Current Sea Level Rises Day By Day and
Description of the temperature record Causes-
Public health and safety is not a partisan issue. Ensuring the welfare of American citizens is arguably the most important job of the federal government. Therefore, we should question why, when the Environmental Protection Agency sets out to regulate harmful greenhouse gasses, we let rhetorical attacks about economic devastation or job destruction influence the rational restriction of a proven health threat to not only U.S. citizens, but the entire world.
The Clean Air Act and 2007 U.S. Supreme Court decision in Massachusetts v. EPA make the Obama administration legally responsible for protecting citizens from the harmful effects of greenhouse gasses and other pollutants. The upcoming EPA regulations are not a case of the president trying to force his agenda through a regulative agency when legislation has failed. Instead, this is a case of performing his obligation to protect health and safety through whichever agency is best equipped to do so.
The EPA is just beginning a multi-year process of regulating greenhouse gas emissions from facilities such as power plants and oil refineries, many of which are already being regulated due to their production of smog, soot and other harmful pollutants. Since Jan. 2, the EPA has been able to regulate factories and other polluters based primarily upon their greenhouse gas emissions. This will force plants to regulate and limit their emissions to obtain permits from the EPA.
Importantly, the EPA is not setting out on a rushed, idealistic crusade against climate change. They are calmly and methodically continuing a process they have performed for years, working with state and local agencies, adjusting to new science and information and acting with a careful eye toward any possible economic effects of regulation.
The greatest benefit from this new policy is the slowing of global climate change. The science behind global climate change or global warming has seen an unfortunate rise in opposition in the past few years, due in great part to rhetorical attacks about “cooked” science, and a manufactured opposition from studies and scientists that have never been accepted by the larger academic community. Compounding this are the media outlets that insist on stressing this artificial opposition and discounting the studies and evidence being presented by experts who have observed the changes, both large and small, that our planet is undergoing.
According a list of the top six priorities Issa has lined up for hearings , obtained by Politico, global warming is nowhere to be found.
Now, Issa spokesman Kurt Bardella assures Post Carbon that political observers shouldn't read too much into this: "Just because it isn't on our hearing list doesn't mean we're not looking at it."
But given incoming House Energy and Commerce Committee Chairman Fred Upton's (R-Mich.) eagerness to take on the Environmental Protection Agency and its efforts to regulate greenhouse gases, it's a safe bet that much of the initial action will take place at Upton's panel, rather than Issa's.
By- Derek Palmer
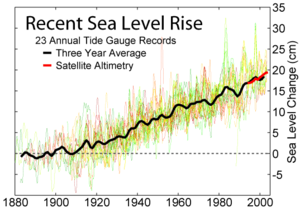
Sea level measurements from 23 long tide gauge records in geologically stable environments show a rise of around 200 millimetres (8 inches) per century, or 2 mm/year.
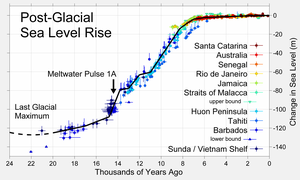
Changes in sea level since the end of the last glacial episode
Current Sea Level Rise has occurred at a mean rate of 1.8 mm per year for the past century, and more recently, during the satellite era of sea level measurement, at rates estimated near 2.8 ± 0.4 to 3.1 ± 0.7 mm per year (1993–2003). Current sea level rise is suggested to be due significantly to global warming, which will increase sea level over the coming century and longer periods. Increasing temperatures result in sea level rise by the thermal expansion of water and through the addition of water to the oceans from the melting of mountain glaciers, ice caps and ice sheets. At the end of the 20th century, thermal expansion and melting of land ice contributed roughly equally to sea level rise, while thermal expansion is expected to contribute more than half of the rise in the upcoming century.
Values for predicted sea level rise over the course of this century typically range from 90 to 880 mm, with a central value of 480 mm. Models of glacier mass balance (the difference between melting and accumulation of snow and ice on a glacier) give a theoretical maximum value for sea level rise in the current century of 2 metres (and a "more plausible" one of 0.8 metres), based on limitations on how quickly glaciers can melt.
The Geologic temperature record are changes in Earth's environment as determined from geologic evidence on multi-million to billion (109) year time scales. The study of past temperatures provides an important paleoenvironmental insight because it is a crucial component of the climate and oceanography of the time.
Description of the temperature record-
Recent past-

Five Million Years of Climate Change
The last 3 million years have been characterized by cycles of glacials and interglacials within a gradually deepening ice age. These cycles involve the growth and retreat of continental ice sheets in the Northern Hemisphere and involve fluctuations on 40,000 and 100,000 year time scales. Such cycles are usually interpreted as being driven by predictable changes in the Earth orbit known as Milankovitch cycles. The gradual intensification of this ice age over the last 3 million years has been associated with declining concentrations of the greenhouse gas carbon dioxide, though it remains unclear if this change is sufficiently large to have caused the changes in temperatures. Decreased temperatures can cause a decrease in carbon dioxide as, by Henry's Law, carbon dioxide is more soluble in colder waters, which may account for 30ppmv of the 100ppmv decrease in carbon dioxide concentration during the last glacial maximum.
Similarly, the initiation of this deepening phase also corresponds roughly to the closure of the Isthmus of Panama by the action of plate tectonics. This prevented direct ocean flow between the Pacific and Atlantic, which would have had significant effects on ocean circulation and the distribution of heat. However, modeling studies have been ambiguous as to whether this could be the direct cause of the intensification of the present ice age.
This recent period of cycling climate is part of the more extended ice age that began about 40 million years ago with the glaciation of Antarctica.
Temperature record of the past 1000 years-

Reconstructions of Northern Hemisphere temperatures for the 2nd millennium according to various older articles (bluish lines), newer articles (reddish lines), and instrumental record (black line)
The temperature record of the 2nd millennium describes the reconstruction of temperatures since 1000 CE on the Northern Hemisphere, later extended back to 1 CE and also to cover the southern hemisphere. A reconstruction is needed because a reliable surface temperature record exists only since about 1850. Studying past climate is of interest for scientists in order to improve the understanding of current climate variability and, relatedly, providing a better basis for future climate projections. In particular, if the nature and magnitude of natural climate variability can be established, scientists will be able to better detect and attribute anthropogenic global warming. Note, however, that although temperature reconstructions from proxy data help us understand the character of natural climate variability, attribution of recent climate change relies on a broad range of methodologies of which the proxy reconstructions are only a small part.
According to all major temperature reconstructions published in peer-reviewed journals (see graph), the increase in temperature in the 20th century and the temperature in the late 20th century is the highest in the record. Attention has tended to focus on the early work of Michael E. Mann, Bradley and Hughes (1998), whose "hockey stick" graph was featured in the 2001 United Nations Intergovernmental Panel on Climate Change report. The methodology and data sets used in creating the Mann et al. (1998) version of the hockey stick graph are disputed by Stephen McIntyre and Ross McKitrick, but the graph is overall acknowledged by the scientific community.

Instrumental Temperature record of the last 150 years.
Overview of sea-level change-
Local and eustatic sea level-
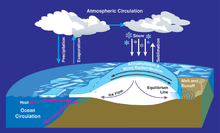
Water cycles between ocean, atmosphere, and glaciers.
“Eustatic” change (as opposed to local change) results in an alteration to the global sea levels, such as changes in the volume of water in the world oceans or changes in the volume of an ocean basin.
Satellite sea level measurement-

Satellite Measurement of Sea Level.

1993-2010 Sea level trends from satellite altimetry.
Sea level rise estimates from satellite altimetry are 3.1 ± 0.4 mm/yr for 1993-2003 (Leuliette et al. (2004)). This exceeds those from tide gauges. It is unclear whether this represents an increase over the last decades; variability; true differences between satellites and tide gauges; or problems with satellite calibration. Knowing the current altitude of a satellite which can measure sea level to a precision of about 20 millimetres (e.g. the Topex/Poseidon system) is primarily complicated by orbital decay and the difference between the assumed orbit and the earth geoid . This problem is partially corrected by regular re-calibration of satellite altimeters from land stations whose height from MSL is known by surveying. Over water, the height is calibrated from tide gauge data which is needed to correct for tides and atmospheric effects on sea level.
The lack of strong policy around the world to hold back global warming is in many ways not surprising since national/parochial issues generally dominate all peoples' common interests to have a habitable planet. A world common interest requires U.S. leadership, and we are stalled in disputes about whether mankind has caused global warming.
We are as a nation sleepwalking through the time of our greatest responsibility in the history of our country.
When warming melts the permafrost and the great ice sheets of Greenland melt even faster that they are today, future generations will ask in dismay, “How could those before us who had it so good let this have happened?”
Ocean current Situation-

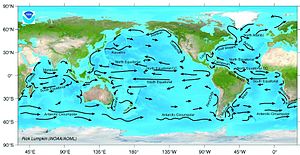
The ocean currents.
An ocean current is a continuous, directed movement of ocean water generated by the forces acting upon this mean flow, such as breaking waves, wind, Coriolis force, temperature and salinity differences and tides caused by the gravitational pull of the Moon and the Sun. Depth contours, shoreline configurations and interaction with other currents influence a current's direction and strength.
Ocean currents can flow for great distances, and together they create the great flow of the global conveyor belt which plays a dominant part in determining the climate of many of the Earth’s regions. Perhaps the most striking example is the Gulf Stream, which makes northwest Europe much more temperate than any other region at the same latitude. Another example is the Hawaiian Islands, where the climate is cooler (sub-tropical) than the tropical latitudes in which they are located, due to the effect of the California Current.
Ice-cover changes:
Permanent ice cover on land is a result of a combination of low peak temperatures and sufficient precipitation. Some of the coldest places on Earth, such as the dry valleys of Antarctica, lack significant ice or snow coverage due to a lack of snow. Sea ice however maybe formed simply by low temperature, although precipitation may influence its stability by changing albedo, providing an insulating covering of snow and effecting heat transfer. Global warming has the capacity to alter both precipitation and temperature, resulting in significant changes to ice cover. Furthermore, the behaviour of ice sheets, ice caps and glaciers is altered by changes in temperature and precipitation, particularly as regards the behaviour of water flowing into and through the ice.
Arctic sea ice-

Arctic sea ice minima in 2005, 2007, and the 1979-2000 average.
Recent projections of sea ice loss suggest that the Arctic ocean will likely be free of summer sea ice sometime between 2059 and 2078.
Models showing decreasing sea ice also show a corresponding decrease in polar bear habitat. Some scientists see the polar bear as a species which will be affected first and most severely by global warming because it is a top-level predator in the Arctic, which is projected to warm more than the global average. Recent reports show polar bears resorting to cannibalism, and scientists state that these are the only instances that they have observed of polar bears stalking and killing one another for food.
Function-
Major ocean surface currents, (Source: NOAA).

Device to record ocean currents.
Surface ocean currents are generally wind driven and develop their typical clockwise spirals in the northern hemisphere and counter-clockwise rotation in the southern hemisphere because of the imposed wind stresses. In wind driven currents, the Ekman spiral effect results in the currents flowing at an angle to the driving winds. The areas of surface ocean currents move somewhat with the seasons; this is most notable in equatorial currents.
Ocean basins generally have a non-symmetric surface current, in that the eastern equatorward-flowing branch is broad and diffuse whereas the western poleward-flowing branch is very narrow. These western boundary currents (of which the gulf stream is an example) are a consequence of basic fluid dynamics.
Deep ocean currents are driven by density and temperature gradients. Thermohaline circulation, also known as the ocean's conveyor belt, refers to the deep ocean density-driven ocean basin currents. These currents, which flow under the surface of the ocean and are thus hidden from immediate detection, are called submarine rivers. These are currently being researched using a fleet of underwater robots called Argo. Upwelling and downwelling areas in the oceans are areas where significant vertical movement of ocean water is observed.
Surface currents make up about 10% of all the water in the ocean. Surface currents are generally restricted to the upper 400 m (1,300 ft) of the ocean. The movement of deep water in the ocean basins is by density driven forces and gravity. The density difference is a function of different temperatures and salinity. Deep waters sink into the deep ocean basins at high latitudes where the temperatures are cold enough to cause the density to increase.
Ocean currents are measured in Sverdrup (Sv), where 1Sv is equivalent to a volume flow rate of 1,000,000 m3 (35,000,000 cu ft) per second.
Importance-

A 1943 map of the world's ocean currents.
Knowledge of surface ocean currents is essential in reducing costs of shipping, since they reduce fuel costs. In the sail-ship era knowledge was even more essential. A good example of this is the Agulhas current, which long prevented Portuguese sailors from reaching India. Even today, the round-the-world sailing competitors employ surface currents to their benefit. Ocean currents are also very important in the dispersal of many life forms. An example is the life-cycle of the eel.
Ocean currents are important in the study of marine debris, and vice versa. These currents also affect temperatures throughout the world. For example, the current that brings warm water up the north Atlantic to northwest Europe stops ice from forming by the shores, which would block ships from entering and exiting ports.
Local climate change-

The first recorded South Atlantic hurricane, "Catarina", which hit Brazil in March 2004
Regional effects of global warming vary in nature. Some are the result of a generalised global change, such as rising temperature, resulting in local effects, such as melting ice. In other cases, a change may be related to a change in a particular ocean current or weather system. In such cases, the regional effect may be disproportionate and will not necessarily follow the global trend.
There are three major ways in which global warming will make changes to regional climate: melting or forming ice, changing the hydrological cycle (of evaporation and precipitation) and changing currents in the oceans and air flows in the atmosphere. The coast can also be considered a region, and will suffer severe impacts from sea level rise.
Geomagnetic effects-

Solar particles interact with Earth's magnetosphere
The Earth's polar aurorae are visual displays created by interactions between the solar wind, the solar magnetosphere, the Earth's magnetic field, and the Earth's atmosphere. Variations in any of these affect aurora displays.
Sudden changes can cause the intense disturbances in the Earth's magnetic fields which are called geomagnetic storms.
Solar proton events
Energetic protons can reach Earth within 30 minutes of a major flare's peak. During such a solar proton event, Earth is showered in energetic solar particles (primarily protons) released from the flare site. Some of these particles spiral down Earth's magnetic field lines, penetrating the upper layers of our atmosphere where they produce additional ionization and may produce a significant increase in the radiation environment.
Galactic cosmic rays-
Solar wind and magnetic field create heliosphere around solar system.
An increase in solar activity (more sunspots) is accompanied by an increase in the "solar wind," which is an outflow of ionized particles, mostly protons and electrons, from the sun. The Earth's geomagnetic field, the solar wind, and the solar magnetic field deflect galactic cosmic rays (GCR). A decrease in solar activity increases the GCR penetration of the troposphere and stratosphere. GCR particles are the primary source of ionization in the troposphere above 1 km (below 1 km, radon is a dominant source of ionization in many areas).
Levels of GCRs have been indirectly recorded by their influence on the production of carbon-14 and beryllium-10. The Hallstatt solar cycle length of approximately 2300 years is reflected by climatic Dansgaard-Oeschger events. The 80–90 year solar Gleissberg cycles appear to vary in length depending upon the lengths of the concurrent 11 year solar cycles, and there also appear to be similar climate patterns occurring on this time scale.
Sea level-
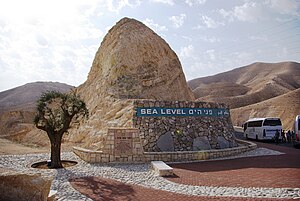
This marker indicating the sea level is placed on the path from Jerusalem to the Dead Sea.
Mean sea level (MSL) is a measure of the average height of the ocean's surface (such as the halfway point between the mean high tide and the mean low tide); used as a standard in reckoning land elevation. MSL also plays an extremely important role in aviation, where standard sea level pressure is used as the measurement datum of altitude at flight levels.
Southern Alliance for Clean Energy is now releasing Spanish versions of our newly created, state specific, global warming fact sheets. Through these translated materials, SACE is continuing its effort to educate the Latino community on the current and future impacts of global warming in the Southeast and the United States as a whole. For far too long, Hispanics have been marginalized in the political process due to simple language barriers; an astounding fact given that over 15% of our country self-identifies as being of this ethnicity.
In addition to the latest factsheets, SACE translated its ”Treasured Places in Peril: Florida Everglades” and “Sea Level Rise in Florida” educational videos in early 2010, both of which can the importance of educating Latino communities in Florida.
Unfortunately, minority communities are often not involved in climate and energy issues primarily due to language and cultural barriers. Yet the Hispanic population is growing in the Southeast, and we believe it is becoming more and more crucial to increase their participation in the climate debate, if not because many of these communities will face the brunt of global warming impacts, then for the simple fact that equal access and participation among all people is the very cornerstone of democracy.
The “Treasured Places in Peril: Florida Everglades” and “Sea Level Rise in Florida” educational videos have been seen by thousands of people and show what we have to lose if we don’t curb global warming pollution. These videos respectively take viewers on a journey through the Florida Keys and Everglades National Park, interviewing concerned citizens and scientists who are already seeing and feeling the effects of global warming as well as visually depicting the sea level rise scenarios anticipated to affect Florida’s coastal cities in the coming years.
Global warming will affect everyone, yet studies show that it will affect some more than others. For example, there are nearly 4 million Hispanics in the state of Florida, comprising almost a quarter of the population. Furthermore, Hispanics in the state earn on average $7,000 less a year than the average non-Hispanic white person. This disparity in income is important because a recent Oxfam America report highlighted that race and economic status play a key role in how much a person will be impacted by global warming. The only way we can protect Latinos living in vulnerable areas is through education and encouraging increased participation to demand strong state and federal climate and energy policies from their legislators.
While the factsheets and educational videos won’t solve the problem, SACE hopes that through these tools, we are supporting the advancement of an important step to help educate millions of Spanish-speaking people in the Southeast about critical global warming issues. SACE is proud to continue our work toward including minorities in the climate debate.
by-Hanna Ingber Win
Lush green tea plantations, so bright they often look fluorescent, blanket the hills of Assam in northeastern India. Women plucking the leaves in black aprons with large baskets on their backs dot the gardens that contribute to India's production of nearly a third of the world's tea. But this picturesque industry that the British began in the early 19th-century faces a very modern problem: climate change.
Researchers and planters worry that a rise in temperatures and change in rainfall patterns are threatening the production and quality of Assam's famous tea.
About 850 tea gardens in Assam produce 55 percent of India's tea, but crop yields are decreasing and amid fears of a correlation with environmental change. Production in the state fell from 564,000 tons in 2007 to 487,000 tons in 2009, and the crop was estimated to have fallen to 460,000 tons in 2010, according to the Assam Branch Indian Tea Association. "Climate changing is definitely happening," said Mridul Hazarika, the director of the Tea Research Association, which is conducting studies on how the changes are hitting tea production. "It is affecting the tea gardens in a number of ways."
In the tea-growing areas of Assam, average temperatures have risen 2C and rainfall has fallen by more than a fifth in the past 80 years. Globally, 2010 was the hottest year on record, according to temperature readings by Nasa's Goddard Institute of Space Studies. An increase in temperatures affects the ability of the plant to grow, Hazarika said.
Tea planters have also noticed that the change in winter temperatures has affected the dormancy period of their plants. Prabhat Bezboruah, a tea planter based in Jorhat, Assam, said that 10 years ago winter temperatures dropped to around 4C or 5C, but the temperature in his region this winter has not gone below 9C. "We're used to seeing everything shut down," he said. "Now what's happening is we're not getting a dormancy. There is still some leaf on the bush."
Mr Bezboruah said the planters must wait and see what result this will have on next year's crop. Another environmental problem for the gardens has been an increase in erratic weather. Weather extremes cause additional stress to the plants, which they have not previously had to deal with, Mr Hazarika said. This stress could affect the bushes' production levels.
April and May saw an unusually high rainfall in the tea-growing areas. The wet and humid conditions led to an explosion in the population of a tropical plant pest.
"When there is a lot of rain and a lot of dampness, certain kinds of insects thrive in tea," said Dhiraj Kakati, the secretary of the Assam Branch Indian Tea Association. He added that no conclusive evidence as of yet has proven that climate change caused this high rainfall or production loss.
Many tea gardens suffered a huge loss from these pests because they did not use aggressive methods to kill the insects. The gardens export their crops and did not use pesticides that are restricted because of environmental concerns, Kakati said.
In addition to the indirect impact on the plants via the pests, last year's excessive rainfall directly hurt the crops because it led to more hours of overcast skies and less sunlight and oxygen, according to Mr Hazarika. His organisation's research found that Assam experienced an average of an hour less of sunshine each day during this past growing season.
There is also a fear among researchers and planters that environmental changes will affect the quality of the tea by weakening its powerful taste.
"So we should aware of about this matter for saving our life and try to keep our environment and air freshness for next generation"
From Wikipedia-
No comments:
Post a Comment